
**Note: This is part 2 of the DOE H2 Hubs series
The previous post looked at the feedstock of the 7 winning H2 Hubs. This time, we will look at the use cases proposed by these hubs. Collectively, these hubs are expected to produce a collective three million metric tons of hydrogen annually—30% of DOE’s 10 million metric tons/year goal by 2030.
Hydrogen: Jack of All Trades, Master of None?
Hydrogen is the Swiss-Army Knife of energy, able to do many things across various greenhouse gas emitting sectors. But, just as you won’t use a Swiss-Army Knife for all possible purposes, you also won’t use hydrogen for everything you could possibly do with it. (Michael Liebreich has a pretty good analogy in his old Hydrogen Ladder post.) As much hype as hydrogen is receiving in the cleantech space, the reality is that it will have to be competitive compared to incumbent energy sources. Clean hydrogen will need to be cheaper, better, more scalable, safer, more convenient than other solutions in order to win its way into the global economy.
In other words, if clean hydrogen is to be an integral part of the clean economy, the hubs will need to successfully demonstrated hydrogen’s role in various end-uses. And that’s why we are talking about the proposed use cases. But right now, clean hydrogen is a jack of all trade and a master of none.
DOE’s End-Use Diversity Focus
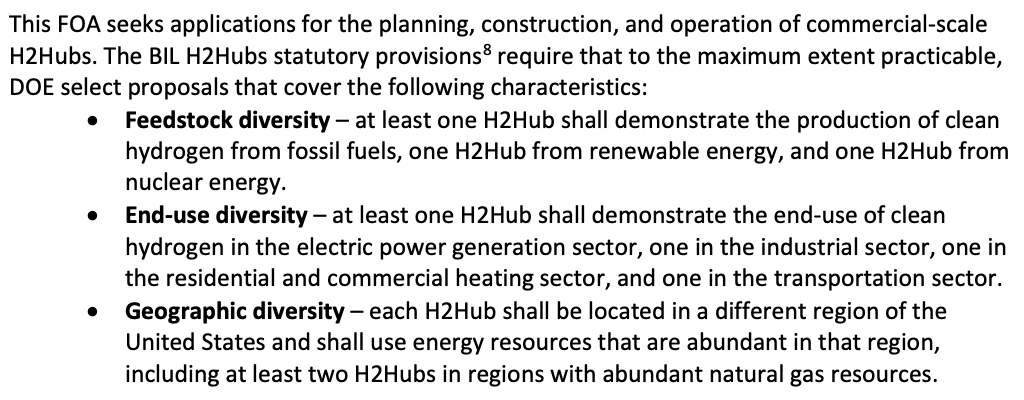
The Bipartisan Infrastructure Law (IIJA) required four end-use sectors to be included in the hubs: industry, transportation, power, and residential and commercial heating. Furthermore, the DOE funding opportunity announcement (FOA) was specifically looking for end-use diversity.
Frankly, the explicit inclusion of residential and commercial heating in the FOA is strange. For space heating in buildings, heat pumps are better and more efficient than hydrogen. Using renewable energy like wind to generate hydrogen and then using hydrogen for heat has a system efficiency of ~50%, compared to over 100% for heat pumps.
Another strange decision from the FOA is that DOE doesn’t seem to differentiate between use cases within a sector. For example, within the transportation sector, while hydrogen can be an excellent fuel candidate for aviation (IPCC category 1A3a) and shipping (IPCC category 1A3d), it is a poor choice for on-road light-duty vehicles (IPCC categories 1A3bi and 1A3bii).
Examining the Use Case Diversity of the 7 H2 Hubs
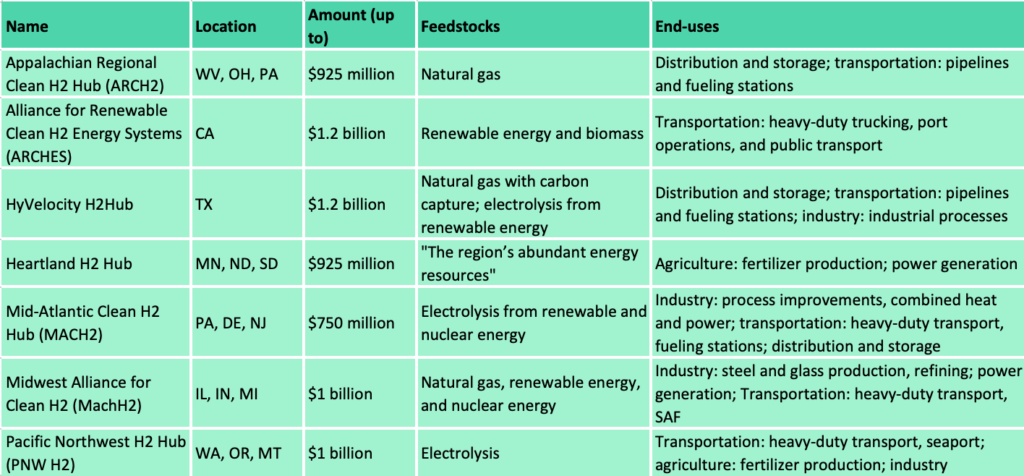
Here is a summary of the proposed end-uses of the 7 winning hubs:

At first glance, the selected hubs do appear to have a diverse proposed use cases collectively, spanning the transportation, industry, agriculture, and the buildings sectors as well as power generation. As expected, transportation and industry have the most sub-sectors and activities listed as proposed end-uses.
Heavy-duty transportation (trucking, buses) lead the way, with 5 hubs proposing it as an end-use, followed by power generation and aviation with 3 hubs.
But is the pursuit of diverse end uses at the expense of optimal allocation of use cases?
It is complicated to say. On one hand, hydrogen may be great for application such as hydrogenation and hydrocracking (a source of diesel and jet fuels), but these applications are rather niche and make up only a sliver of total GHG emissions. On the other hand, hydrogen’s competitiveness varies greatly even within a sub-sector. For example, international shipping, river cruises, and local ferries all fall under the shipping, a transportation sub-sector. Hydrogen ranges from having great potential for decarbonizing international shipping to being uncompetitive for local ferries (where battery-powered ferries may be more suited).
Interestingly, Heartland is the only winning hub that has space heating as a proposed end use while also being the only one without any transportation end-uses. Meanwhile, ARCHES is the only one that has public transportation as a proposed use case. But the problem is, public transportation just doesn’t need hydrogen in most cases. Shuttles and buses don’t travel long distances in a given day, stops frequently to pick up and drop off passengers, have predictable routes, and have depots to return to at the end of every drive shift. Their drive cycles and duty cycles favor battery-powered versions over hydrogen fuel-cell ones. Trains? Probably easier and more economically feasible to electrify the tracks instead.
What about trucks? The majority of the trucks on the road are regional. They might not cover enough miles for hydrogen to make sense. Regional trucks also tend to have a base to return to at the end of shift like buses. That leaves long-distance trucks, which make up a fraction of the trucking fleet but travel a disproportionately large share of vehicle miles. Hydrogen fuel cell could make sense, but current FCEV trucks are multiple times more expensive than diesel-powered trucks or even BEV trucks.
Finally, use cases where hydrogen could really make sense (e.g., fertilizer, ammonia, methanol, and steel production) aren’t popular: each has only 1-2 hubs proposing as end uses. And of these use cases, only fertilizer has no alternative to hydrogen; the rest can be produced using either biofuels or electricity or powered by batteries.
Conclusion
Did DOE miss the mark in the selection process with respect to use cases? Maybe, maybe not. Sure, there are better or worse use cases for hydrogen. Some of these hubs might not even make it to later stages of funding or live up to their promises. But for now, we can expect clean hydrogen supply to remain limited for many years to come. DOE should focus its investments on use cases where hydrogen is irreplaceable instead of making many bets across several use cases.
]]>
All Aboard the Hydrogen Hubs Hype Train
The U.S. Department of Energy (DOE) on Friday announced its selection of 7 much anticipated regional hydrogen hubs (H2Hubs), totalling $7 billion in awards. These hubs are located in various parts of the U.S.—the Appalachia, California, the Gulf Coast, the Northern Great Plains, the Mid-Atlantic, the Midwest, and the Pacific Northwest. Collectively, these hubs are expected to produce a collective three million metric tons of hydrogen annually—30% of DOE’s 10 million metric tons/year goal by 2030.
The following table summarizes these 7 H2Hubs:
Hydrogen can be produced from diverse domestic resources and used across sectors. Production can be centralized or decentralized, grid-connected or off-grid, offering scalability, versatility, and regionality. Hydrogen can be produced from several technology pathways, feedstocks, and have several potential end-uses. It is no wonder that the Biden administration is all-in on the hydrogen hype train.
Recall that the funding opportunity announcement (DE-FOA-0002779) has three selection criteria focused on diversity: feedstock diversity, end-use diversity, and geographic diversity (see excerpt above). At first glance, the selected H2Hubs have covered these three fronts very well. But is that the whole story?
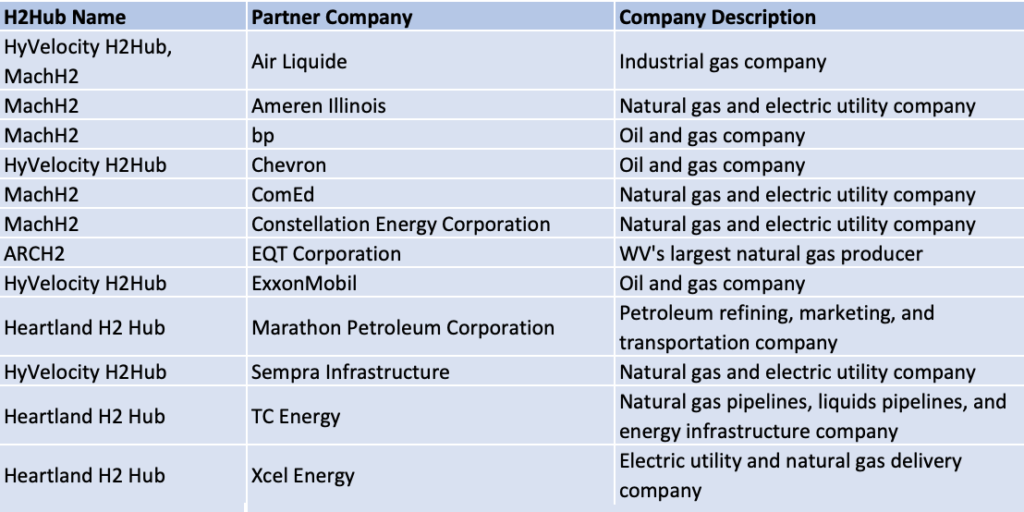
Hydrogen Hubs: A Cash Grab for Big Oil and Gas?
4 out of 7 H2Hubs (ARCH2, HyVelocity H2Hub, Heartland, and MachH2) will produce hydrogen using natural gas, a fossil fuel. This means over half of the H2 hubs will produce so-called blue hydrogen (using fossil fuels with carbon capture and storage). Right now, blue hydrogen is cheaper but dirtier than hydrogen produced from electrolysis from renewable energy and nuclear energy. Of these hubs, ARCH2 will produce hydrogen exclusively from fossil fuel.
Indeed, industry partners backing these 4 hubs include major oil and gas companies. See the table below.
Unfortunately, even the hubs that plan to produce hydrogen using electricity generated from renewable energy and/or nuclear energy aren’t blameless either. In a previous post, I wrote that a lot of renewable energy are waiting to be interconnected due to grid backlog. the grid is woefully outdated and there are not enough transmission lines to support the transition from a fossil fuel-based electric system to a decarbonized energy grid. This means the H2Hubs that plan to produce hydrogen from electrolysis should not divert clean energy from the grid. Otherwise emissions from electricity generation would increase.
Except for ARCH2, these hubs plan to use several methods for hydrogen production, but the exact mix may change depending on which projects make it through the DOE negotiations process. Although the Biden administration has emphasized that roughly two-thirds of the $7 billion pot is associated with the production of hydrogen from renewable energy, it’s too early to tell what the final result would look like (these hub demonstrations will run until around 2032, providing that they meet the milestones set by DOE.)
The next post will look at the end-uses proposed by these hubs.
]]>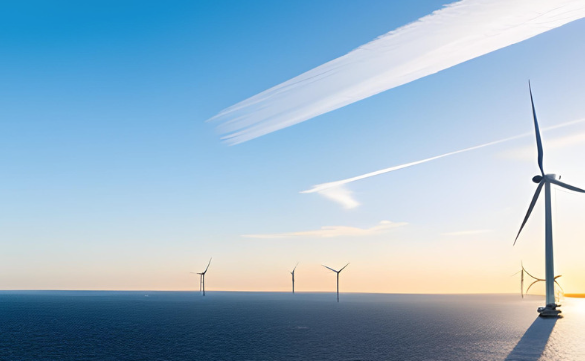
California has one of the longest coastlines (3rd longest per CRS and 5th longest per NOAA), making it an ideal state for offshore wind deployment on paper. The Golden State also has clean energy goals (e.g., Senate Bill 100, Assembly Bill 2514) and is home to the largest cleantech investment ecosystems. Not to mention that offshore wind can help California diversify its clean energy portfolio (which is dominated by solar PV since its landmark climate bill AB 32 was signed into law in 2006.) By embracing offshore wind energy, California can make substantial progress toward its renewable energy goals, create jobs, enhance energy security, and contribute to global efforts to combat climate change. These conditions make it a no-brainer for California to aggressively pursue offshore wind.
Or is it?
There exist concerns and issues such as those on wildlife habitats, grid integration, and permitting and regulatory that California need to address.
Environmental and Ecological Concerns
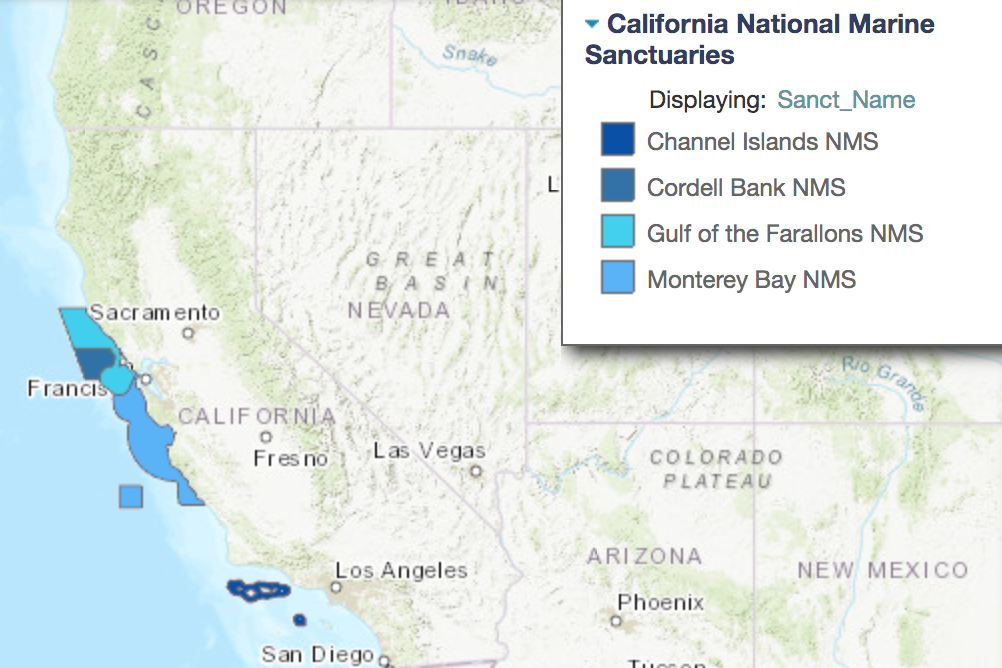
California’s coastal waters are ecologically diverse and home to various marine species. Offshore wind projects can potentially impact marine ecosystems, migratory routes of marine animals, and even local bird populations.
The following maps show California’s national marine sanctuaries and the biological habitat areas off California’s coastline. As you can see, the only area(s) that might not encroach the natural habitats would be the coasts off of rural Northern California, a part of Central Coast, and Southern California.
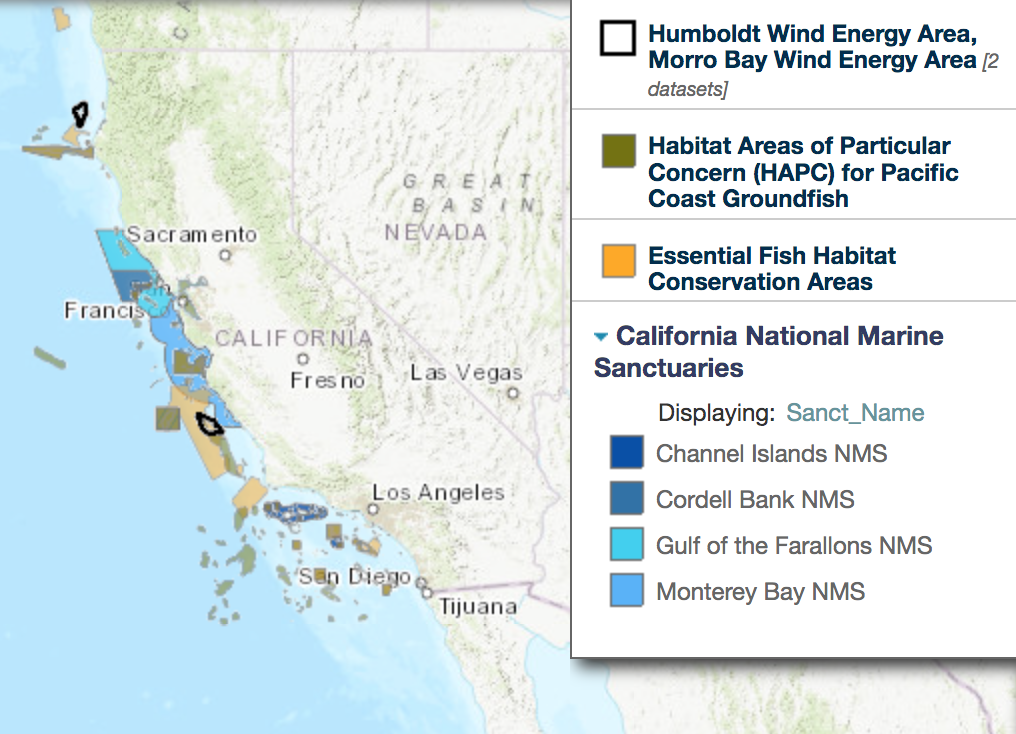
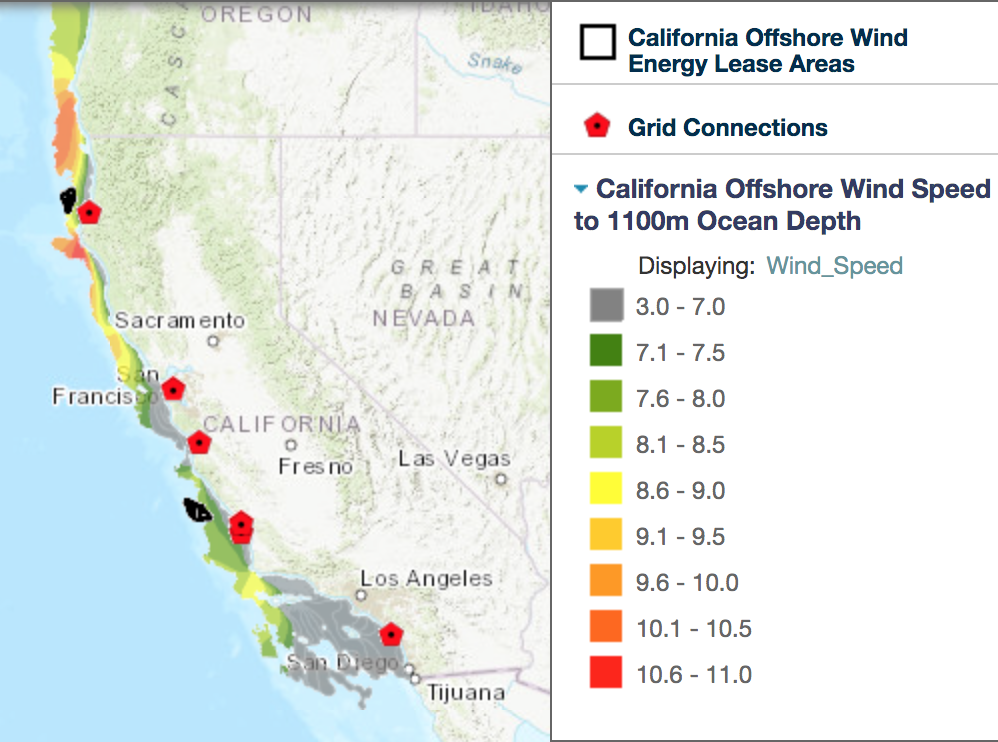
But looking at the offshore wind speed, it is immediately apparent that Southern California has low wind speed, which means that region is not really suitable for deploying offshore wind.
That leaves parts of Central Coast (off of San Luis Obispo County) and rural Northern California (particularly Humboldt County).
Grid Integration Concerns
Integrating offshore wind energy into California’s existing power grid poses technical challenges. The transmission infrastructure needs to be upgraded to transport the electricity generated offshore to where it’s needed onshore. Nationally, the grid is woefully outdated and there are not enough transmission lines to support the transition from a fossil fuel-based electric system to a decarbonized energy grid. About 70% of the grid is more than 25 years old, which can be vulnerable to increasingly intense storms.
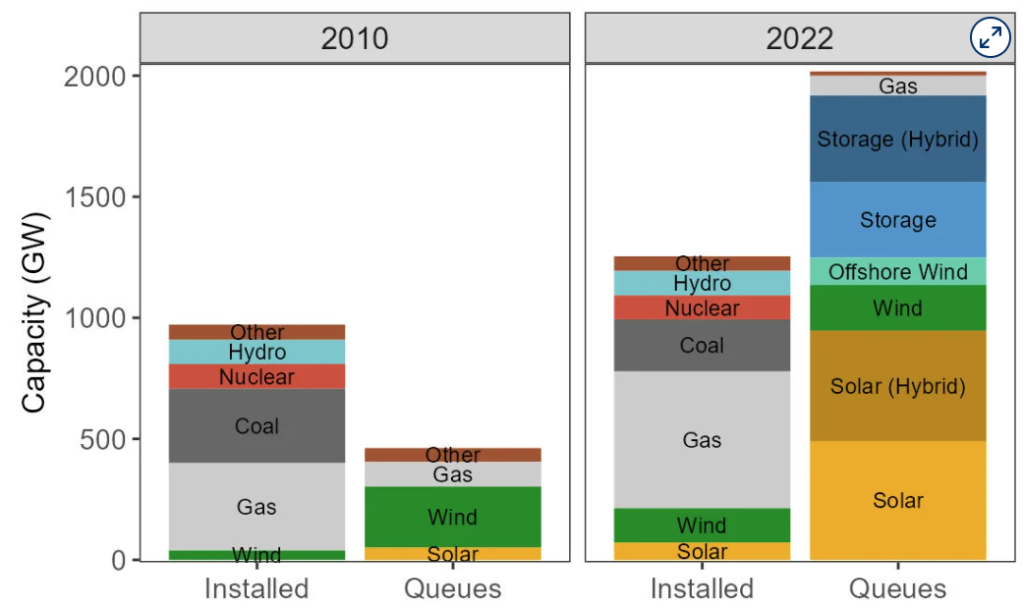
Per the LBNL study (2023), as of the end of 2022, the total capacity active in the queues is growing year-over-year, with >2,000 GW of generation and storage capacity. About half of that are from solar and solar (hybrid). About 150 GW of offshore wind is in active queue capacity.
Another hurdle is the need to balance the intermittent nature of wind energy with the grid’s stability. So far, besides some fundings from the recently climate landmark bills, not much has been done at both the federal and state levels to effectively solve these issues that are decades in the making.
Permitting and Regulatory Concerns
To connect a new source of power to the U.S. electric grid requires energy generators to go through an application process with a regional transmission authority or utility. The interconnection process starts with a request to connect to the grid, which officially enters the power generator in the interconnection queue. Next is a series of studies (e.g. feasibility, system impact and facilities studies) where the grid operator determines what equipment or upgrades will be necessary to get the new power generation on the grid and what it will cost.
Remember that there are not enough transmission lines and renewable energy power generators are waiting to be connected to the grid? To complicate the picture further, interconnection application process is often time consuming and requires upgrades to the grid, which are often so costly that power generators have to back out.
Indeed, of the almost 30,000 observations (year project entered queue range = 1995 to 2022) included in the LBNL study, nationwide, about half of the proposed projects are withdrawn, with another 35% currently in active queue or suspended. Just 13% of these projects are operational.
Of the 15 projects for offshore wind or offshore wind + battery (these entered queue between 2018 to 2021) in CAISO, 6 are in active queue and 9 have been withdrawn. This means none of these projects have yet become operational. (In the LBNL dataset, only one offshore wind project has come online nationwide. It entered queue in 2013 and became operational in 2020.)
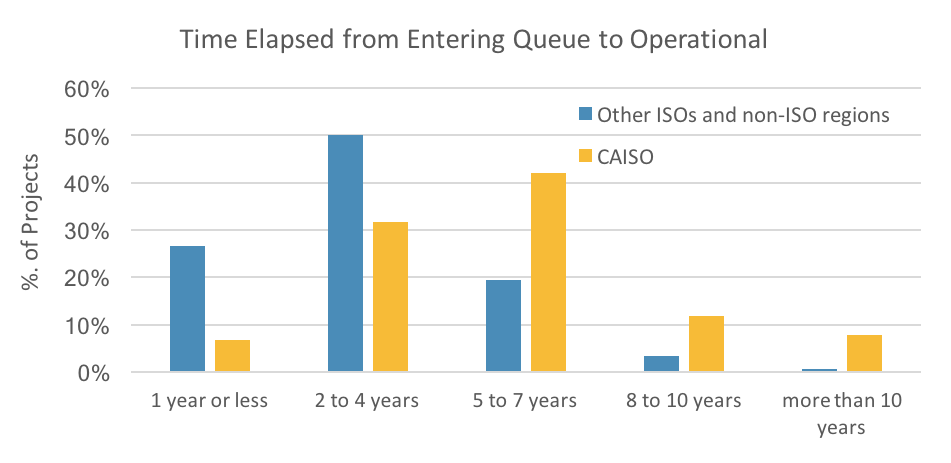
Make no mistake, permitting bottleneck is a pervasive problem plaguing energy projects nationwide. But the problem seems more acute in California. Outside of CAISO, 3/4 of the projects in the dataset took fewer than 5 years from entering the queue to becoming operational. But just 38% of the projects in CAISO jurisdiction took fewer than 5 years to become operational. On the other hand, 1/5 of the projects in CAISO took at least 8 years to come online compared to just 4% of the projects in other regions.
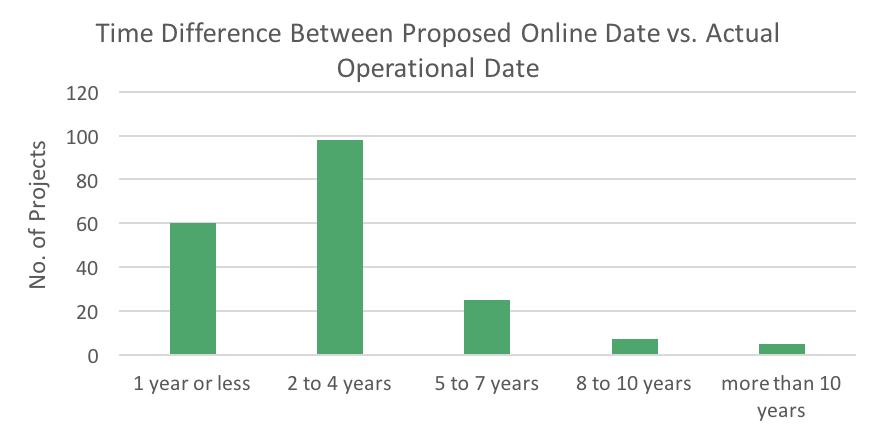
Needless to say, California’s long process means projects that do come online come at later dates than anticipated. These delays often translate to additional project costs. In fact, almost 1/5 of these projects faced a delay of 5 or more years.
California’s burdensome permitting and regulatory environment don’t just apply to energy projects. The state is also famously known for its long and drawn-out processes and CEQA litigations on housing development and infill projects. These issues often make an already expensive project even most cost prohibitive.
Stay tuned for part 2.