
And blah blah blah. Does anyone else feel that it is starting to look a lot like Earth Day  , where people symbolically turn their lights off
  for one hour? Or how about Pride Month, where companies immediately revert their rainbow-color logos to normal the moment July rolls around? It is the time of year that’s become more of a feel-good, virtue signaling exercise than a way to advance climate action.
Some worry that the public perception of this year’s COP has already been on a rocky start. Earlier this year, some members of the United States Congress and the European Parliament expressed concerns on “permitting private sector polluters to exert undue influence on UN Framework Convention on Climate Change (UNFCCC) processes” in a letter.
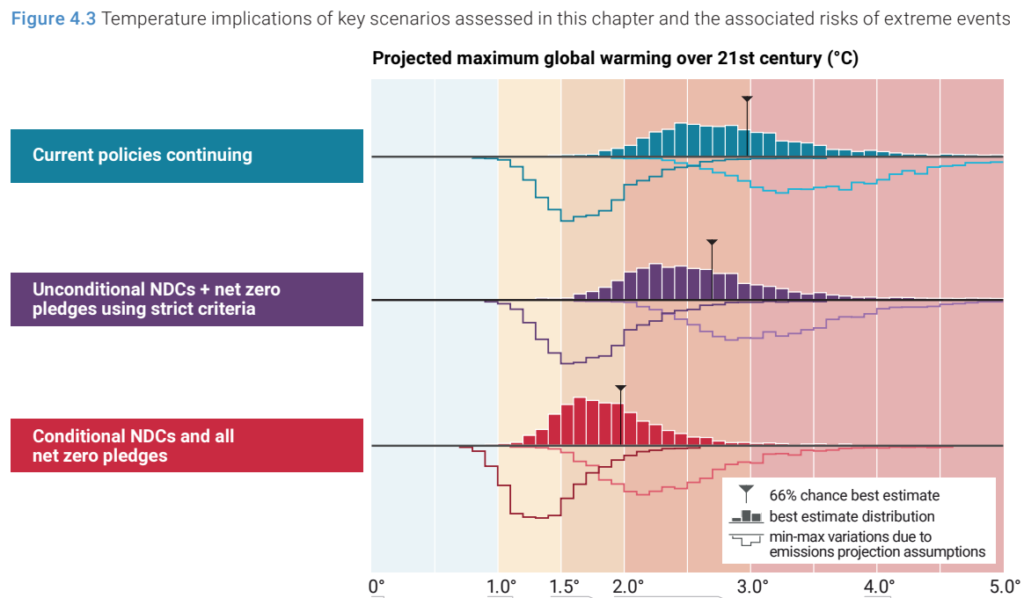
In addition, despite repeated urgings to limit global warming to 1.5 degrees Celsius (the Paris Agreement goal), a new UN report shows that the world is barreling toward 3 degrees Celsius warmer by the end of this century.
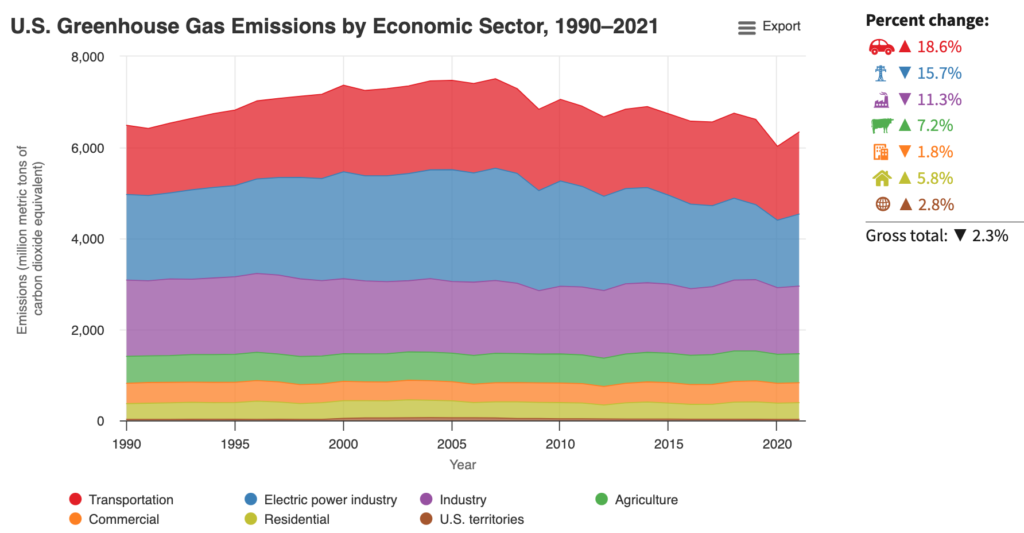
As local, state, federal government, and supranational agencies are racing against time to reduce greenhouse gases, ammonia is gaining attention as a “green” fuel for decarbonizing the transportation sector. But so far, much of that attention on ammonia’s applications has been limited to the marine transportation sub-sector.
Ammonia (NH3) is produced by combining gaseous hydrogen with nitrogen from the air. Large-scale ammonia production uses natural gas for the source of hydrogen (grey hydrogen). However, if the market for clean hydrogen takes off, ammonia can be produced cleanly as well.
To be clear, ammonia fueled engines and vehicles are not new. During World War II, Ammonia (liquid anhydrous ammonia) was used to power buses in Belgium. Around the same time, the Gazamo process (burning a mix of ammonia and hydrogen in internal combustion engine) appeared to be the first application on a large-ish scale, with about 100 vehicles equipped for use of ammonia as fuel.
In the 1960s, the U.S. Military funded the Energy Depot Project, which explored developing alternative fuels (hydrogen, ammonia, and hydrazine) from indigenous materials (water, air, earth) but concluded that as long as hydrocarbons (e.g., gasoline, diesel, kerosene) are available, there was no incentive to use alternative fuels.
Recently, Toyota unveiled a 2-liter, 161 horsepower ammonia powered engine. Built in collaboration with Chinese automaker GAC Motor, the engine is touted to be a revolutionary breakthrough that will end EVs. To make the ammonia engine clean enough to use, Toyota and GAC had to cut nitrogen emissions, which was achieved in part due to an increase in combustion pressure.
There is also something in the works for heavy-duty trucking. Amogy, a cleantech startup that specifically aims to use ammonia to enable the decarbonization of the hard-to-abate sectors, unveiled the world’s first ammonia-powered semi-truck in early 2023. The 300kW semi-truck has 900 kWh of total stored net electric energy and can be refueled in 8 minutes.
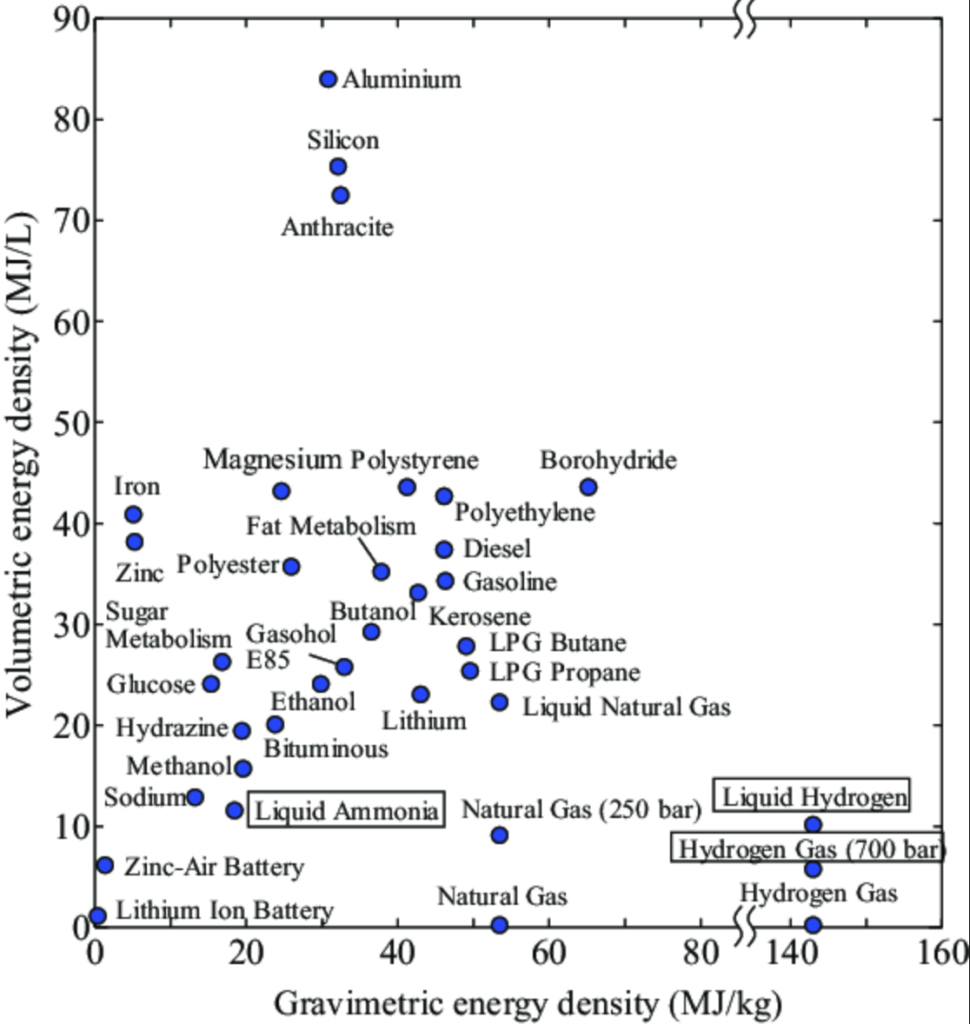
Compared to other candidate clean fuels and fossil fuels, liquid ammonia sits somewhere in the middle of the pack in terms of gravimetric and volumetric densities. It has both lower gravimetric and volumetric densities than gasoline and diesel as well as E85 gasohol. However, it trumps lithium-ion batteries in both and comfortably beats gaseous hydrogen (both 350 bar and 700 bar) in volumetric density. Furthermore, ammonia is liquid at ambient temperature, making it easier to store and transport than hydrogen.
The calorific value of ammonia is 22.5 MJ/kg or about half that of diesel. In a normal engine, in which the water vapor is not condensed, the calorific value of ammonia will be further less (about 20% less). Overall, ammonia is far less energy dense than gasoline and diesel. Ammonia is also more difficult to ignite than gasoline and diesel. It is unclear whether ammonia-powered cars can compete with traditional ICEVs or even EVs.
As one of the most produced and transported chemicals, the infrastructure already exists. Still, ammonia as a motor vehicle fuel would require a significant change to current infrastructures, both in ammonia production and fuel storage and transportation.
Ammonia is a toxic and corrosive compound used extensively in agriculture and pharmaceutical, which raises concerns about safe handling and distribution. While ammonia is stored similarly to propane, fueling stations that can safely and effectively store and distribute ammonia will have several technical challenges and expensive.
Although ammonia is easier to transport and distribute than hydrogen, leakage is still a challenge that needs to be overcome. When released to the environment, though, it becomes a toxic gas. Liquid anhydrous ammonia expands ~850 times when released to ambient air and can form large vapor clouds.
Furthermore, ammonia engines release a significant amount of nitrogen into the atmosphere if they don’t maintain sufficient levels of high compression or boost. This means an improperly tuned or misfiring ammonia motor could potentially have devastating effects on health and the atmosphere.
Do ammonia-powered cars and trucks represent a new paradigm or just another new fad? Perhaps only time will tell.
]]>
**Note: This is part 2 of the DOE H2 Hubs series
The previous post looked at the feedstock of the 7 winning H2 Hubs. This time, we will look at the use cases proposed by these hubs. Collectively, these hubs are expected to produce a collective three million metric tons of hydrogen annually—30% of DOE’s 10 million metric tons/year goal by 2030.
Hydrogen: Jack of All Trades, Master of None?
Hydrogen is the Swiss-Army Knife of energy, able to do many things across various greenhouse gas emitting sectors. But, just as you won’t use a Swiss-Army Knife for all possible purposes, you also won’t use hydrogen for everything you could possibly do with it. (Michael Liebreich has a pretty good analogy in his old Hydrogen Ladder post.) As much hype as hydrogen is receiving in the cleantech space, the reality is that it will have to be competitive compared to incumbent energy sources. Clean hydrogen will need to be cheaper, better, more scalable, safer, more convenient than other solutions in order to win its way into the global economy.
In other words, if clean hydrogen is to be an integral part of the clean economy, the hubs will need to successfully demonstrated hydrogen’s role in various end-uses. And that’s why we are talking about the proposed use cases. But right now, clean hydrogen is a jack of all trade and a master of none.
DOE’s End-Use Diversity Focus
The Bipartisan Infrastructure Law (IIJA) required four end-use sectors to be included in the hubs: industry, transportation, power, and residential and commercial heating. Furthermore, the DOE funding opportunity announcement (FOA) was specifically looking for end-use diversity.
Frankly, the explicit inclusion of residential and commercial heating in the FOA is strange. For space heating in buildings, heat pumps are better and more efficient than hydrogen. Using renewable energy like wind to generate hydrogen and then using hydrogen for heat has a system efficiency of ~50%, compared to over 100% for heat pumps.
Another strange decision from the FOA is that DOE doesn’t seem to differentiate between use cases within a sector. For example, within the transportation sector, while hydrogen can be an excellent fuel candidate for aviation (IPCC category 1A3a) and shipping (IPCC category 1A3d), it is a poor choice for on-road light-duty vehicles (IPCC categories 1A3bi and 1A3bii).
Examining the Use Case Diversity of the 7 H2 Hubs
Here is a summary of the proposed end-uses of the 7 winning hubs:

At first glance, the selected hubs do appear to have a diverse proposed use cases collectively, spanning the transportation, industry, agriculture, and the buildings sectors as well as power generation. As expected, transportation and industry have the most sub-sectors and activities listed as proposed end-uses.
Heavy-duty transportation (trucking, buses) lead the way, with 5 hubs proposing it as an end-use, followed by power generation and aviation with 3 hubs.
But is the pursuit of diverse end uses at the expense of optimal allocation of use cases?
It is complicated to say. On one hand, hydrogen may be great for application such as hydrogenation and hydrocracking (a source of diesel and jet fuels), but these applications are rather niche and make up only a sliver of total GHG emissions. On the other hand, hydrogen’s competitiveness varies greatly even within a sub-sector. For example, international shipping, river cruises, and local ferries all fall under the shipping, a transportation sub-sector. Hydrogen ranges from having great potential for decarbonizing international shipping to being uncompetitive for local ferries (where battery-powered ferries may be more suited).
Interestingly, Heartland is the only winning hub that has space heating as a proposed end use while also being the only one without any transportation end-uses. Meanwhile, ARCHES is the only one that has public transportation as a proposed use case. But the problem is, public transportation just doesn’t need hydrogen in most cases. Shuttles and buses don’t travel long distances in a given day, stops frequently to pick up and drop off passengers, have predictable routes, and have depots to return to at the end of every drive shift. Their drive cycles and duty cycles favor battery-powered versions over hydrogen fuel-cell ones. Trains? Probably easier and more economically feasible to electrify the tracks instead.
What about trucks? The majority of the trucks on the road are regional. They might not cover enough miles for hydrogen to make sense. Regional trucks also tend to have a base to return to at the end of shift like buses. That leaves long-distance trucks, which make up a fraction of the trucking fleet but travel a disproportionately large share of vehicle miles. Hydrogen fuel cell could make sense, but current FCEV trucks are multiple times more expensive than diesel-powered trucks or even BEV trucks.
Finally, use cases where hydrogen could really make sense (e.g., fertilizer, ammonia, methanol, and steel production) aren’t popular: each has only 1-2 hubs proposing as end uses. And of these use cases, only fertilizer has no alternative to hydrogen; the rest can be produced using either biofuels or electricity or powered by batteries.
Conclusion
Did DOE miss the mark in the selection process with respect to use cases? Maybe, maybe not. Sure, there are better or worse use cases for hydrogen. Some of these hubs might not even make it to later stages of funding or live up to their promises. But for now, we can expect clean hydrogen supply to remain limited for many years to come. DOE should focus its investments on use cases where hydrogen is irreplaceable instead of making many bets across several use cases.
]]>
All Aboard the Hydrogen Hubs Hype Train
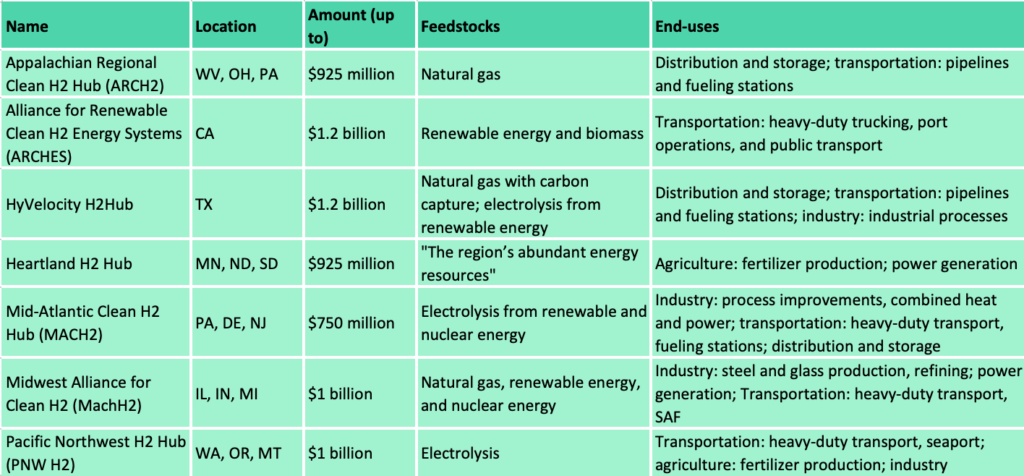
The U.S. Department of Energy (DOE) on Friday announced its selection of 7 much anticipated regional hydrogen hubs (H2Hubs), totalling $7 billion in awards. These hubs are located in various parts of the U.S.—the Appalachia, California, the Gulf Coast, the Northern Great Plains, the Mid-Atlantic, the Midwest, and the Pacific Northwest. Collectively, these hubs are expected to produce a collective three million metric tons of hydrogen annually—30% of DOE’s 10 million metric tons/year goal by 2030.
The following table summarizes these 7 H2Hubs:
Hydrogen can be produced from diverse domestic resources and used across sectors. Production can be centralized or decentralized, grid-connected or off-grid, offering scalability, versatility, and regionality. Hydrogen can be produced from several technology pathways, feedstocks, and have several potential end-uses. It is no wonder that the Biden administration is all-in on the hydrogen hype train.
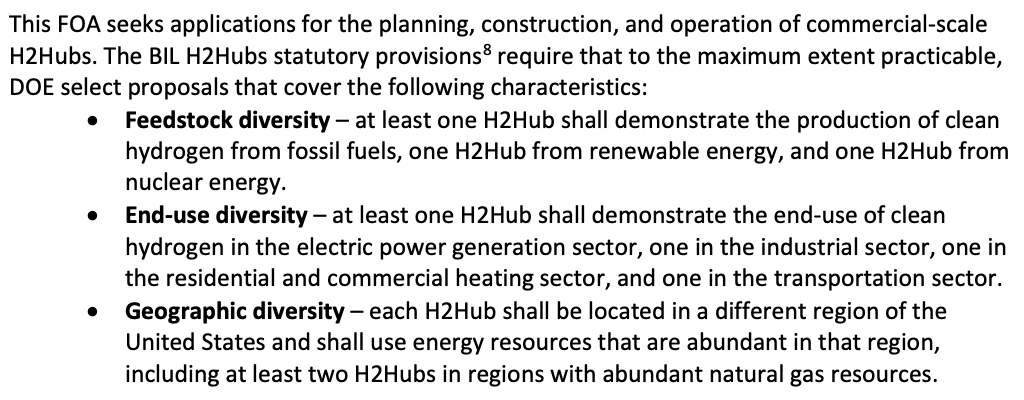
Recall that the funding opportunity announcement (DE-FOA-0002779) has three selection criteria focused on diversity: feedstock diversity, end-use diversity, and geographic diversity (see excerpt above). At first glance, the selected H2Hubs have covered these three fronts very well. But is that the whole story?
Hydrogen Hubs: A Cash Grab for Big Oil and Gas?
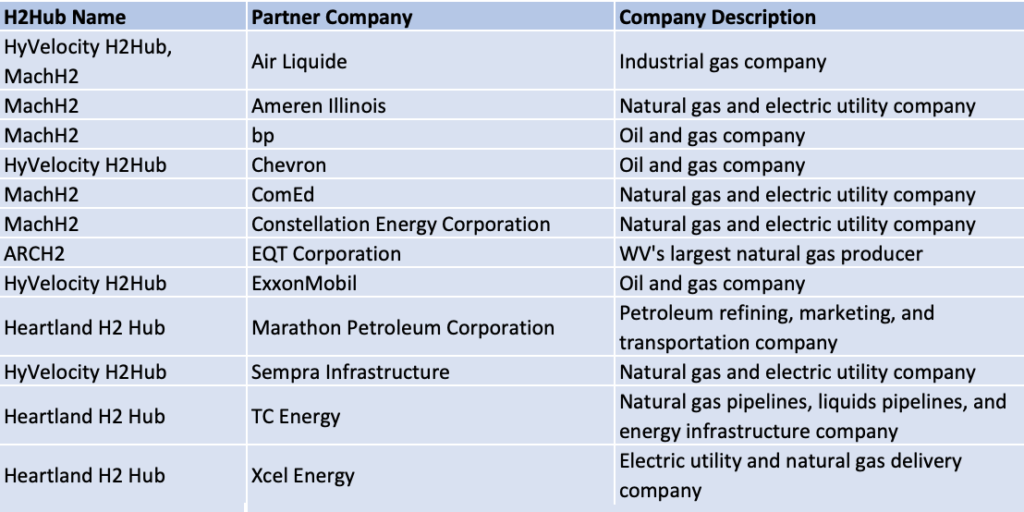
4 out of 7 H2Hubs (ARCH2, HyVelocity H2Hub, Heartland, and MachH2) will produce hydrogen using natural gas, a fossil fuel. This means over half of the H2 hubs will produce so-called blue hydrogen (using fossil fuels with carbon capture and storage). Right now, blue hydrogen is cheaper but dirtier than hydrogen produced from electrolysis from renewable energy and nuclear energy. Of these hubs, ARCH2 will produce hydrogen exclusively from fossil fuel.
Indeed, industry partners backing these 4 hubs include major oil and gas companies. See the table below.
Unfortunately, even the hubs that plan to produce hydrogen using electricity generated from renewable energy and/or nuclear energy aren’t blameless either. In a previous post, I wrote that a lot of renewable energy are waiting to be interconnected due to grid backlog. the grid is woefully outdated and there are not enough transmission lines to support the transition from a fossil fuel-based electric system to a decarbonized energy grid. This means the H2Hubs that plan to produce hydrogen from electrolysis should not divert clean energy from the grid. Otherwise emissions from electricity generation would increase.
Except for ARCH2, these hubs plan to use several methods for hydrogen production, but the exact mix may change depending on which projects make it through the DOE negotiations process. Although the Biden administration has emphasized that roughly two-thirds of the $7 billion pot is associated with the production of hydrogen from renewable energy, it’s too early to tell what the final result would look like (these hub demonstrations will run until around 2032, providing that they meet the milestones set by DOE.)
The next post will look at the end-uses proposed by these hubs.
]]>
Recently, the Department of Energy (DOE) posted a request for information (RFI) regarding the development of green shipping corridors (GSCs) between the United States and the United Kingdom (DE-FOA-0003156). The purpose of the RFI is to solicit feedback from maritime stakeholders on issues related to the establishment of green shipping corridors between the U.S. and the U.K.
We are pleased to submit our comments regarding the U.K.-U.S. GSCs. This post summarizes the main points raised in our filing.
Read the filing below.
What are Green Shipping Corridors?
Green shipping corridors are maritime routes that showcase zero- and near zero- emission lifecycle fuels and technologies with the ambition to achieve zero greenhouse gas emissions across all aspects of the corridor in support of sector-wide decarbonization no later than 2050.
The concept of GSCs debuted back in COP26 as part of the First Movers Coalition. This means decarbonization of the maritime sector was NOT part of the Paris Agreement in 2015.
Ideally, Green shipping corridors should lay the ground for the massive reductions that will happen once these solutions roll out globally. Within the purview of this RFI, if the U.K.-U.S. partnership is successful, then ultimately zero-emission shipping should be a commercially viable option that can be deployed anywhere and not just on certain routes by 2030.
Challenges and Barriers
There are several challenges and barriers for a green shipping corridor between the U.S. and U.K.
Regarding technology barriers, uncertainty on the fuel pathways persists at the global level, and there is no clear alternative fuel of choice (unlike, say, sustainable aviation fuel for the aviation sector). Innovation must stimulate the further development of several fuel options to support a multi-fuel mix future suitable for different modes of operation and geography. But existing constraints on time and investments imply that it may be infeasible and impractical to place many bets.
Regarding policy challenges, some of them involve vessel types and implementation challenges. Currently, most of the proposed green shipping corridors focus primarily on container ships, but these are “low hanging fruits” that are relatively easier to decarbonize and comprise less than a quarter of the maritime sector’s total emissions. Furthermore, DOE should consider carefully whether it wants to implement a phased approach or go for zero- and near-zero emission demonstrations immediately. While a phased approach may ease the transition, relying on fossil fuels during an interim period may jeopardize the sector’s ability to fully decarbonize by 2050.
Regarding regulatory challenges, it is not certain whether the two countries are on the same page regarding the life-cycle assessment of shipping emissions. As a parallel, for sustainable aviation fuel (SAF), Argonne National Lab’s GREET model and the International Civil Aviation Organization’s CORSIA have different estimates of SAF’s life cycle emissions. And then there’s the Jones Act, the century old law that restricts water transportation of cargo between U.S. ports to ships that are U.S.-owned, U.S.-crewed, U.S.-registered, and U.S.-built… how will the U.K. deal with the Jones Act?
]]>But Doug Casey’s International Man recently published the eponymous article claiming that “the big push for EVs represents something much worse than that.” It claims that EVs are likely an integral part of the Great Reset—the dystopian future the global elite has envisioned for mankind—a high-tech form of feudalism.
The article specifically calls out 3 reasons why the big push for EVs is sinister: (1) EVs Are Not Green; (2) EVs Can’t Compete Without Government Support; and (3) EVs Are About Controlling You.
What is Doug Casey’s International Man?
Doug Casey’s International Man bills itself as a trusted source of unique information for tens of thousands of freedom seekers, investors, adventurers, and speculators. Its mantra is that “international diversification is the ultimate insurance policy against an out-of-control government.”
Some of you might be familiar with Doug Robert Casey. He is an American writer, speculator, and the founder and chairman of Casey Research. He describes himself as an anarcho-capitalist influenced by the works of writer and philosopher Ayn Rand. He wrote the best-selling financial book, Crisis Investing, in 1979. His Casey Research, along with the International Man, specialize in economics, finance, and geopolitics.
The article discussed here is by Nick Giambruno, Doug Casey’s protégé. Like Casey, Giambruno is a strategic investor with a penchant for emerging trends.
Now that the introduction is out of the way, let’s unpack each of these claims, yes?
Claim #1: EVs Are Not Green
The International Man article uses 3 points to make its claim that EVs are not green: (a) EVs do not really reduce carbon emissions; they just rearrange them; (b) Extracting and processing the exotic materials needed to make EVs requires tremendous power in remote locations, which only hydrocarbons can provide; and (c) EVs require an enormous amount of rare elements and metals—like lithium and cobalt—that companies mine in conditions that couldn’t remotely be considered friendly to the environment.
While it is true that EVs are not green in a sense that they don’t have zero or near zero life-cycle emissions, the author left out much details to substantiate his points. Let’s examine each of these points.
Regarding the first point, the author did not further substantiate what he meant by that EVs simply rearrange carbon emissions. However, the author did state earlier that “hydrocarbons generate over 60% of the electricity in the US. That means there’s an excellent chance that oil, coal, or gas is behind the electricity charging an EV.” Essentially, what this author was saying is that EVs shift tailpipe emissions to emissions from electricity.
Although Giambruno correctly pointed that 60% of the electricity in the US (utility scale generation) is generated from coal, petroleum, and natural gas in 2022, the author failed to show whether EVs are dirtier than conventional hybrid electric vehicles and internal combustion engine vehicles based on the electric power mix. Numerous studies have already concluded that EVs have lower life-cycle, well-to-wheel greenhouse gas emissions than ICEVs (see here, here, and here for example).
The author also failed to mention that a lower share of electricity is generated from hydrocarbons overtime, decreasing from 68% in 2013 to 60% in 2022, and likely even lower in the future. This is something that one can easily look up at Table 1.1 of EIA’s Electric Power Monthly. This means emissions from EVs are expected to be lower as hydrocarbons’ share of generation falls. And if the gravimetric densities of batteries continue to improve, EVs will become even more efficient, hence further lowering emissions.
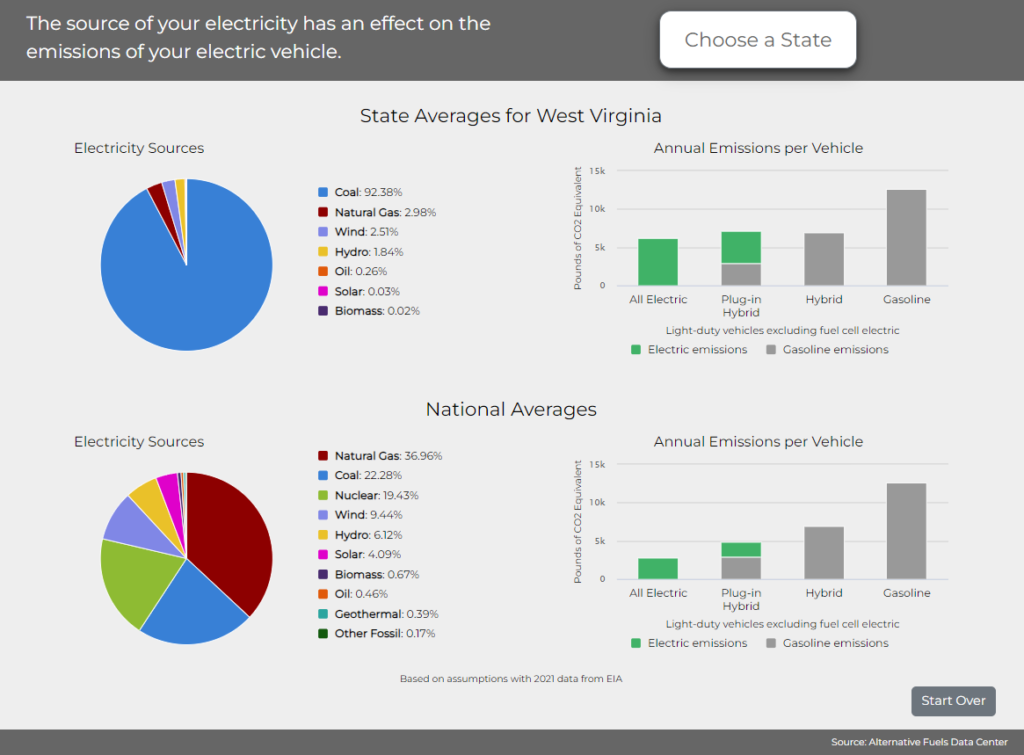
Indeed, the Department of Energy’s Alternative Fuels Data Center has a calculator that compares annual emissions by powertrain. Even in the most coal-heavy states like West Virginia and Wyoming, EVs (and plug-in hybrids) both have substantially lower emissions than ICEVs per annum.
Well, actually, when comparing EVs vs. ICEVs emissions, what should be looked at is the marginal emissions. But since the author didn’t bring it up, that’s outside of the scope here.
Regarding the second point, although Giambruno correctly points out that “extracting and processing the exotic materials needed to make EVs requires tremendous power” and that power mostly comes from hydrocarbons, the author did not substantiate how much hydrocarbon is consumed relative to the life-cycle of EVs.
Regarding the third point, the author did raise an important and valid point here: EVs require an enormous amounts of rare earth elements (REEs) and metals like lithium, cobalt, and nickel. Indeed, there are serious environmental and social justice issues around the mining of these elements. Mainstream media have already talked about lithium and cobalt mining’s devastating impacts on communities in countries such as Chile and DR Congo (e.g., the Guardian, the NYT, the NPR, the Verge, and the Financial Times).
Claim #2: EVs Can’t Compete Without Government Support
Although this author had some good criticisms questioning whether EVs are green, unfortunately, his next point is erred by numerous omissions, which makes this claim disingenuous at best and perhaps even misleading.
The $393 billion EV subsidy the author cited refers to the clean vehicle tax credits in the Inflation Reduction Act (Public Law 117-169). The bill text itself did not state that the EV subsidy will total $393 billion from 2022 to 2031; that figure is from the Penn Wharton Budget Model, which in turn is based on a recent Goldman Sachs report “Carbonomics: The Third American Energy Revolution” (redacted version; see Exhibits 3 and 36). Note that this $393 billion is Goldman Sachs’ own estimate, which is significantly greater than the Congressional Budget Office’s $14 billion estimate for EV tax credits (subtotals of Sec. 13401 – 13404).
Compared to the CBO’s estimate of $391 billion in total for all climate and energy programs over 2022 – 2031, Goldman Sachs’ estimated that the IRA could cost the government around $1.2trn through to 2032, three times the CBO estimate. But what is omitted in the International Man article is what immediately followed in Goldman Sachs’ report, i.e., “[t]his material government contribution would in turn unlock US$3trn of infrastructure investments to 2032 (a 2.5x multiplier vs c.$1.2trn government incentives).”
In other words, the author conveniently left out the infrastructure investments that would spur from the IRA.
The author also conveniently left out the part where the U.S. provides $10 billion to $50 billion per year in subsidies for fossil fuel (hydrocarbons), or $5.9 trillion globally in 2020.
But let’s focus on the meat of the claim, that EVs can’t compete without government support. Particularly, the author wrote that “[a]ccording to J.D. Power, a consumer research firm, the average EV still costs at least 21% more than the average gasoline vehicle.”
I don’t know which J.D. Power article the author was referring to (the author did not provide a link), but J.D. Power has several articles on the cost of EVs), including one where leased BEVs are more affordable than ICEVs and another one where BEVs are approaching cost parity with ICEVs over 5 years of ownership. If readers like me can’t tell where the claim “EVs still cost 21% more than average gasoline vehicle” comes from, then the author’s argument boils down to nothing more than “trust me, bro.”
Also, do you see a recurring theme here? Just as the author failed to provide life-cycle emissions comparisons in his previous claim that EVs are not green, here the author failed to provide life-cycle total cost of ownership comparisons or at least the total cost of ownership over a period of time.
Claim #3: EVs Are About Controlling You
The second claim is merely a baseless assertion, but the third and final claim sounds straight up like a fearmongering conspiracy hypothesis. Let’s unpack this.
The author claims that EVs control people because they are spy machines. That EVs collect an unimaginable amount of data on you, which governments can access easily.
But the author didn’t differentiate between EVs and ICEVs – what makes EVs spying machines that modern ICEVs aren’t? For example, the author wrote, “[h]ad the Canadian truckers’ vehicles been EVs, the government would have been able to stamp out the resistance much easier.”
But the problem is, the author did not explain just how the situation with the Canadians truckers would had turned out differently if they drove EV trucks instead of gasoline/diesel trucks. What are the components that are specific to EVs only (such as the battery cells) that make them prone to be spy machines? The article didn’t say.
By the way, modern ICEVs also collect “an unimaginable amount of data” on drivers. The sensors in automobiles — from telematics to fully digitized control consoles — have made them prodigious data-collection hubs. For example, cars have microphones that people have all sorts of conversations with and cameras that face inward and outward. These parts are present regardless of the vehicle powertrain. The Los Angeles Times has a recent article that talked about privacy concerns in automobiles.
If Giambruno can specifically identify and elaborate what makes EVs spying machines (that gasoline vehicles are not), I am all ears. But otherwise, this claim again boils down to “trust me, bro.”
]]>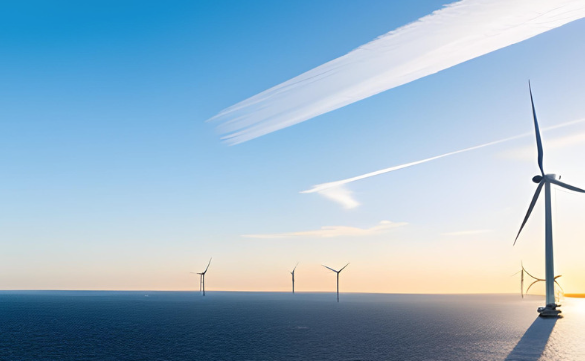
California has one of the longest coastlines (3rd longest per CRS and 5th longest per NOAA), making it an ideal state for offshore wind deployment on paper. The Golden State also has clean energy goals (e.g., Senate Bill 100, Assembly Bill 2514) and is home to the largest cleantech investment ecosystems. Not to mention that offshore wind can help California diversify its clean energy portfolio (which is dominated by solar PV since its landmark climate bill AB 32 was signed into law in 2006.) By embracing offshore wind energy, California can make substantial progress toward its renewable energy goals, create jobs, enhance energy security, and contribute to global efforts to combat climate change. These conditions make it a no-brainer for California to aggressively pursue offshore wind.
Or is it?
There exist concerns and issues such as those on wildlife habitats, grid integration, and permitting and regulatory that California need to address.
Environmental and Ecological Concerns
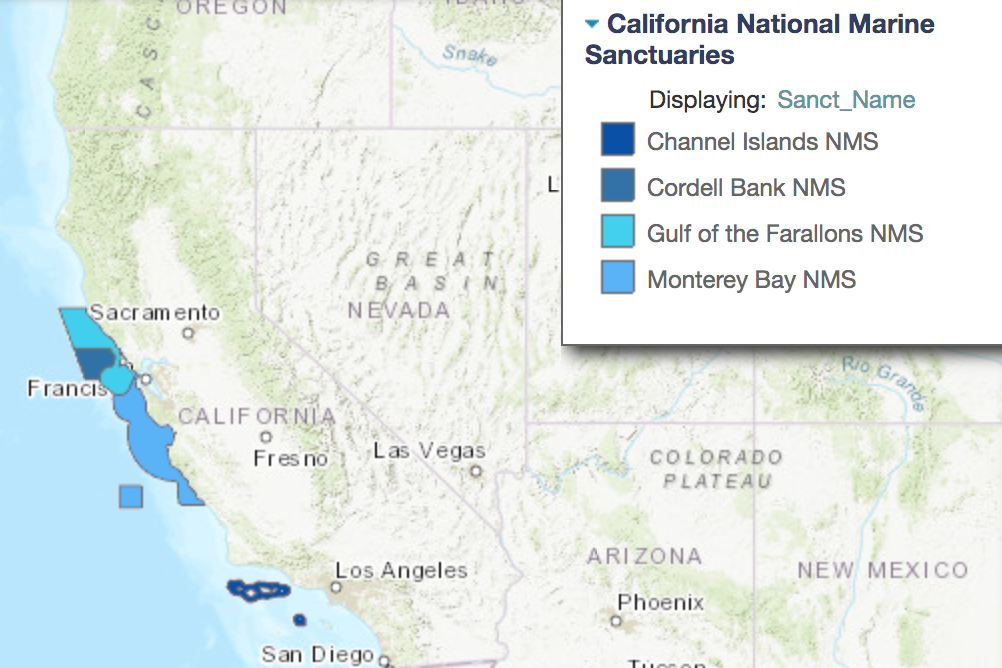
California’s coastal waters are ecologically diverse and home to various marine species. Offshore wind projects can potentially impact marine ecosystems, migratory routes of marine animals, and even local bird populations.
The following maps show California’s national marine sanctuaries and the biological habitat areas off California’s coastline. As you can see, the only area(s) that might not encroach the natural habitats would be the coasts off of rural Northern California, a part of Central Coast, and Southern California.
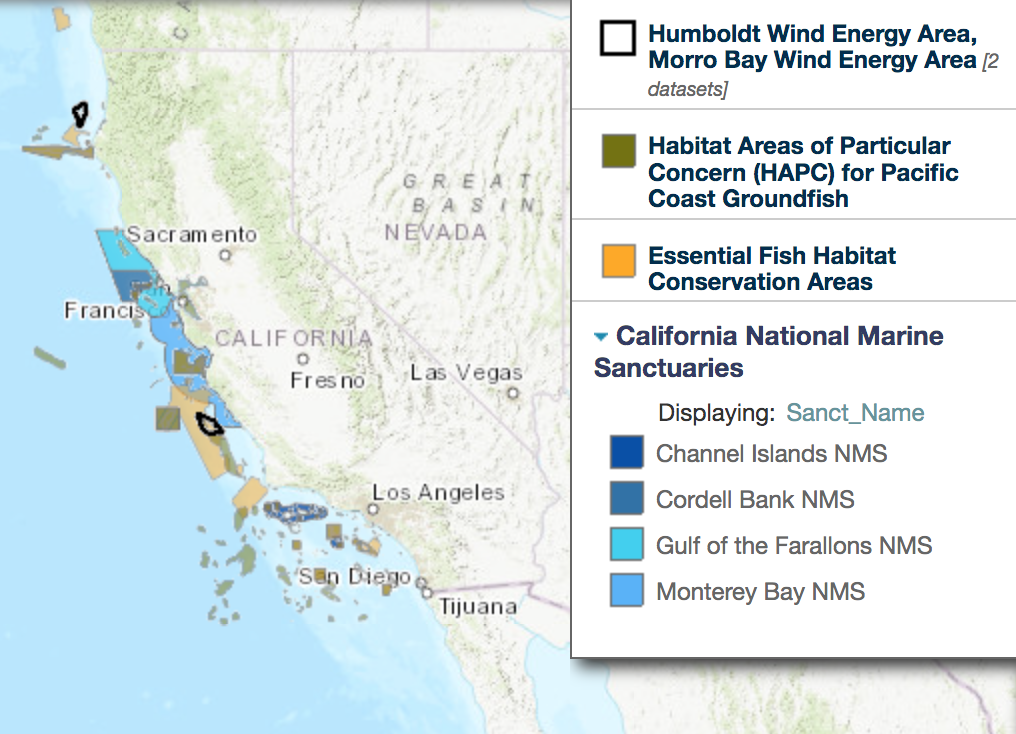
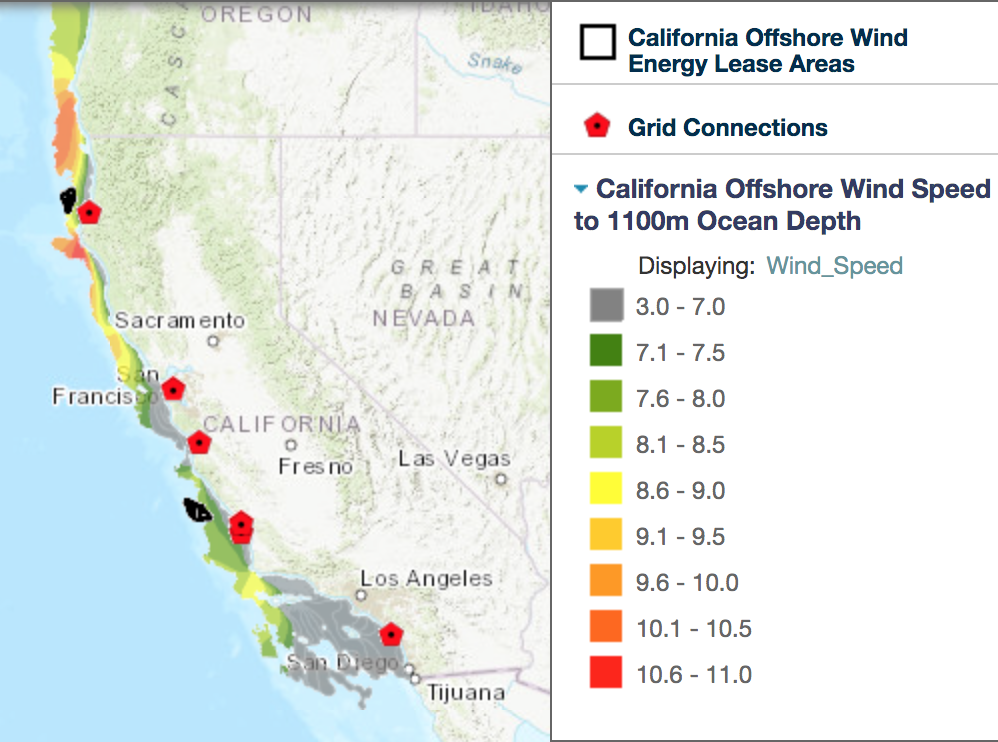
But looking at the offshore wind speed, it is immediately apparent that Southern California has low wind speed, which means that region is not really suitable for deploying offshore wind.
That leaves parts of Central Coast (off of San Luis Obispo County) and rural Northern California (particularly Humboldt County).
Grid Integration Concerns
Integrating offshore wind energy into California’s existing power grid poses technical challenges. The transmission infrastructure needs to be upgraded to transport the electricity generated offshore to where it’s needed onshore. Nationally, the grid is woefully outdated and there are not enough transmission lines to support the transition from a fossil fuel-based electric system to a decarbonized energy grid. About 70% of the grid is more than 25 years old, which can be vulnerable to increasingly intense storms.
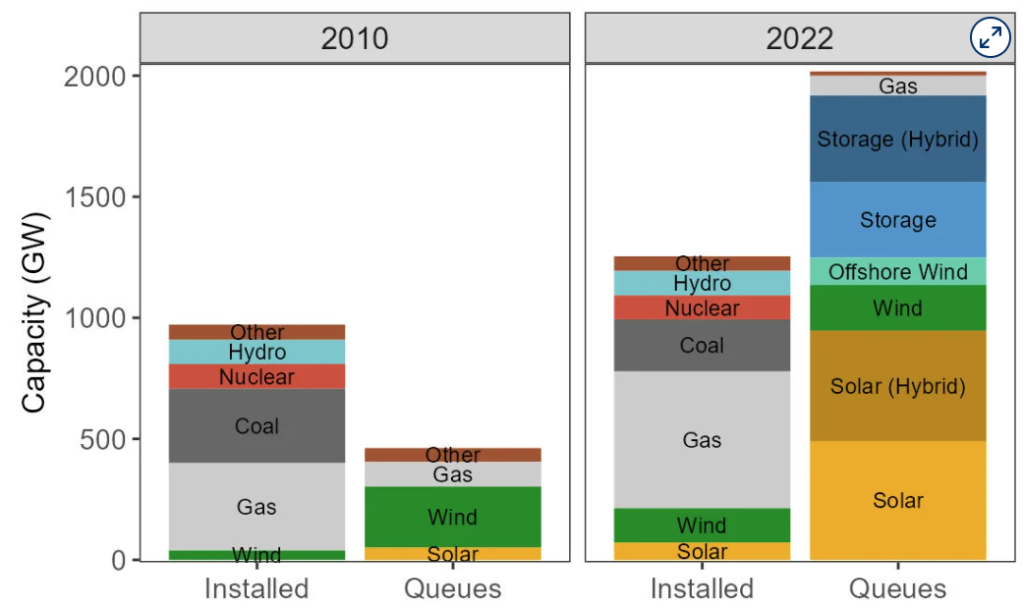
Per the LBNL study (2023), as of the end of 2022, the total capacity active in the queues is growing year-over-year, with >2,000 GW of generation and storage capacity. About half of that are from solar and solar (hybrid). About 150 GW of offshore wind is in active queue capacity.
Another hurdle is the need to balance the intermittent nature of wind energy with the grid’s stability. So far, besides some fundings from the recently climate landmark bills, not much has been done at both the federal and state levels to effectively solve these issues that are decades in the making.
Permitting and Regulatory Concerns
To connect a new source of power to the U.S. electric grid requires energy generators to go through an application process with a regional transmission authority or utility. The interconnection process starts with a request to connect to the grid, which officially enters the power generator in the interconnection queue. Next is a series of studies (e.g. feasibility, system impact and facilities studies) where the grid operator determines what equipment or upgrades will be necessary to get the new power generation on the grid and what it will cost.
Remember that there are not enough transmission lines and renewable energy power generators are waiting to be connected to the grid? To complicate the picture further, interconnection application process is often time consuming and requires upgrades to the grid, which are often so costly that power generators have to back out.
Indeed, of the almost 30,000 observations (year project entered queue range = 1995 to 2022) included in the LBNL study, nationwide, about half of the proposed projects are withdrawn, with another 35% currently in active queue or suspended. Just 13% of these projects are operational.
Of the 15 projects for offshore wind or offshore wind + battery (these entered queue between 2018 to 2021) in CAISO, 6 are in active queue and 9 have been withdrawn. This means none of these projects have yet become operational. (In the LBNL dataset, only one offshore wind project has come online nationwide. It entered queue in 2013 and became operational in 2020.)
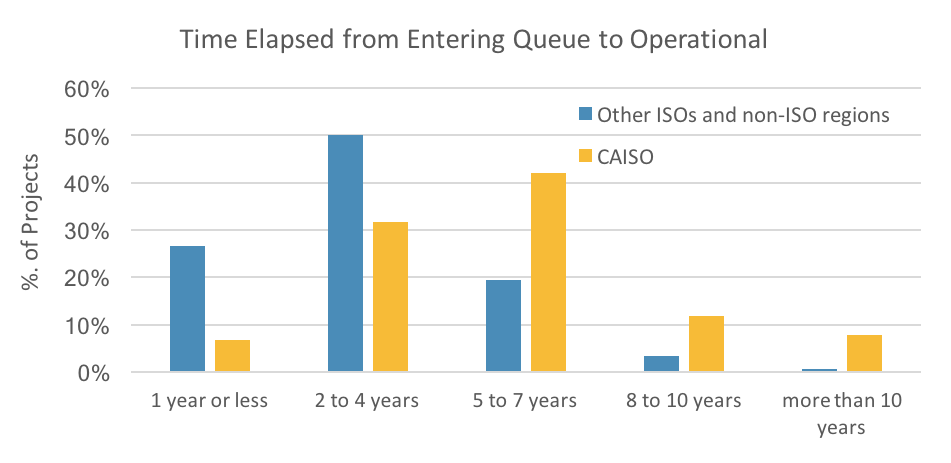
Make no mistake, permitting bottleneck is a pervasive problem plaguing energy projects nationwide. But the problem seems more acute in California. Outside of CAISO, 3/4 of the projects in the dataset took fewer than 5 years from entering the queue to becoming operational. But just 38% of the projects in CAISO jurisdiction took fewer than 5 years to become operational. On the other hand, 1/5 of the projects in CAISO took at least 8 years to come online compared to just 4% of the projects in other regions.
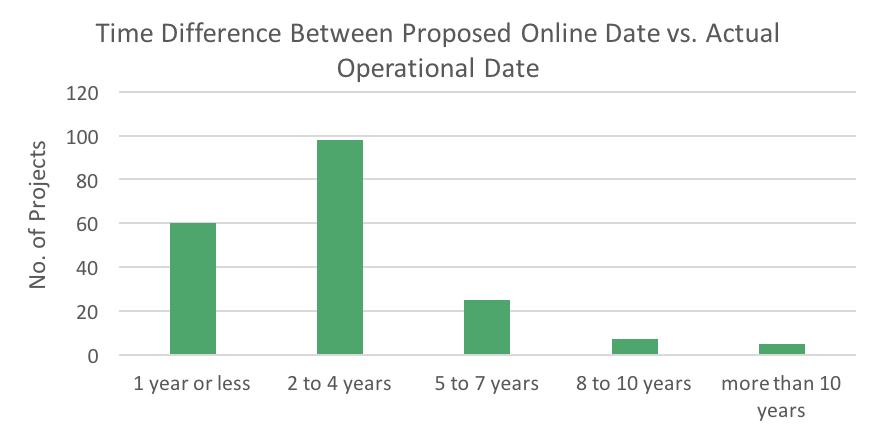
Needless to say, California’s long process means projects that do come online come at later dates than anticipated. These delays often translate to additional project costs. In fact, almost 1/5 of these projects faced a delay of 5 or more years.
California’s burdensome permitting and regulatory environment don’t just apply to energy projects. The state is also famously known for its long and drawn-out processes and CEQA litigations on housing development and infill projects. These issues often make an already expensive project even most cost prohibitive.
Stay tuned for part 2.